Below are two examples of the two computational modelling approaches used to investigate brain connectivity. Bayesian approaches are used to detect the dynamic network structure in the human brain. Dynamic causal modeling is used to investigate state dependent changes in the connectivity patterns within a pre-defined network.
Study 1
Andersen KW, Madsen KH, Siebner HR, Schmidt MN, Mørup M, Hansen LK (2014) Non-parametric Bayesian graph models reveal community structure in resting state fMRI. NeuroImage 100:301–315.
 This study investigated new Bayesian graph theoretical approaches to model brain connectivity in resting-state functional magnetic resonance imaging (fMRI). However, the approaches are applicable on other connectivity modalities, such as diffusion weighted imaging or EEG.
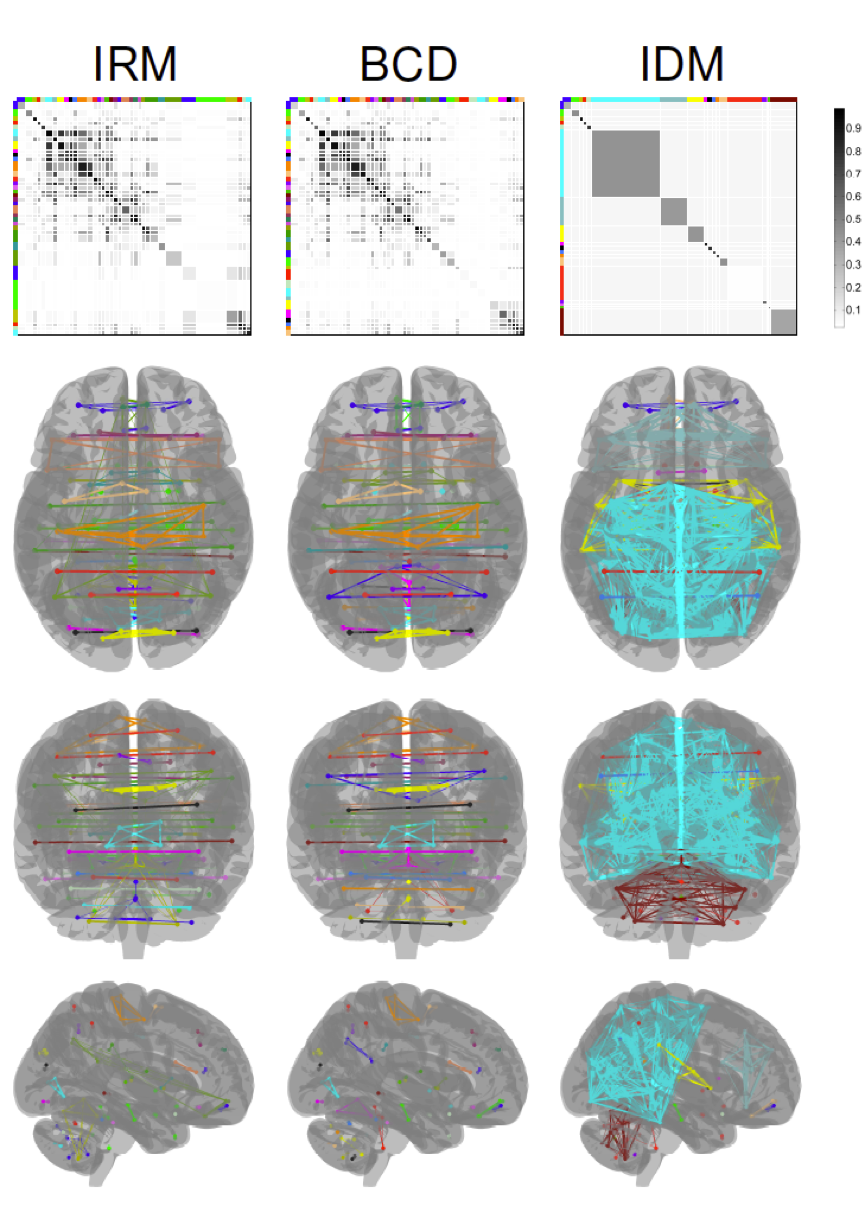
In particular, we tested the different approaches’ ability to predict unseen data and their ability to reproduce clustering across datasets. The three generative models considered are the Infinite Relational Model (IRM), Bayesian Community Detection (BCD), and the Infinite Diagonal Model (IDM). Three different datasets comprising healthy volunteers' rs-fMRI we found that the BCD model was in general the most predictive and reproducible model. This model restricts the between-cluster link probabilities to be strictly lower than within-cluster link probabilities to conform to the community structure typically seen in social networks. This suggests that rs-fMRI data exhibits community structure and furthermore points to the significance of modeling heterogeneous between-cluster link probabilities.
The extracted clusters using the three methods IRM, BCD, and IDM respectively. The first row shows the link probability matrices ρ, which have been permuted such that the order of the clusters corresponds across methods. The matrix elements are color-coded according to the value of the link probabilities and the size of the matrix element indicates the size of the respective cluster. The colors next to the matrices correspond to different clusters. The next three rows show the clusters in three different views (superior, posterior, and lateral) of the brain. The clusters are color coded according to the colors next to the link probability matrices. Different brain regions within each cluster are connected with lines where the thickness of the line indicates the average link density across subjects for the specific connection.
Study 2
Herz DM, Haagensen BN, Christensen MS, Madsen KH, Rowe JB, Løkkegaard A, Siebner HR (2015) Abnormal dopaminergic modulation of striato-cortical networks underlies levodopa-induced dyskinesias in humans. Brain 138:1658-66.
 In this study we combined computational modeling of neural connectivity and functional magnetic resonance imaging in order to elucidate how dopamine can have deleterious effects on motor control. While levodopa therapy alleviates basal ganglia dysfunction in Parkinson’s disease, it often elicits involuntary movements, referred to as levodopa-induced peak-of-dose dyskinesias. Here, we used a novel pharmacodynamic neuroimaging approach to identify the changes in cortico-basal ganglia connectivity that herald the emergence of levodopa-induced dyskinesias. Twenty-six patients with Parkinson’s disease received a single dose of levodopa and then performed a task in which they had to produce or suppress a movement in response to visual cues. Dynamic causal modelling was applied to assess levodopa-induced modulation of connectivity between the pre-supplementary motor area, primary motor cortex and putamen when patients suppressed a motor response. Patients who later developed levodopa-induced dyskinesias, but not patients without dyskinesias, showed a linear increase in connectivity between the putamen and primary motor cortex after levodopa intake during movement suppression. Our results identify for the first time, aberrant dopaminergic modulation of striatal-cortical connectivity as a neural signature of levodopa-induced dyskinesias in humans.
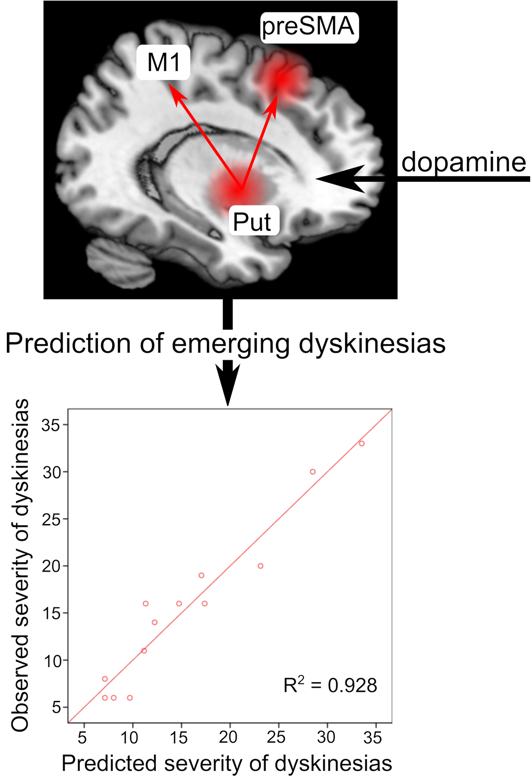
The figure illustrates that mapping of the neural network re-organization after dopamine intake
allowed precise predictions about the severity of LID even before they emerged. In the upper panel, red spheres indicate changes in activity of preSMA and putamen, which were related to the emergence of LID. Red arrows indicate that feedback connectivity from the putamen to M1 and preSMA significantly improved predictions of LID compared to a regression model, which only contained changes in neural activity. The lower panel shows that the hierarchical multiple linear regression model explained almost 93 % variance of inter-individual differences in LID scores.